| https:///weradocs/Plott_UV.shtml |
C	------------------------------------------------------------------------
C	Configuration for Nice / Corsica Experiment:
C	------------------------------------------------------------------------
C
        NST             =  2    !Number of WERA sites (radial files)

C	Name and size (NX, NY) of Grid File
C
C	Valudes used to generate Nice_grid_55_61.asc :
C	Spacing [km] 2.0
C	Upper left corner: LAT 43 45.0  LON 7 55.0
C
	NX              = 60
	NY              = 67
	GRID_NAME	= '/home/wera/etc/Nice_grid_60_67.asc'

C       Name of Watt File
C
c       WATT            = .TRUE.        !.true. = Read Watt file
        WATT            = .FALSE.       !.true. = Read Watt file
	WATT_NAME	= '/home/wera/etc/Nice_watt_60_67.asc'
C
	ASC_DIR		= '/home/wera/data/asc/' !Directory for currents
	WASC_DIR	= '/home/wera/data/wasc' !Directory for waves
        !
	CODE 		= 'Cor' 	!Code in 2-dim current file
	!
C       Name of GDOP File
	GDOP_NAME	= '/home/wera/etc/Nice_GDOP_60_50.dat'
	!
C	Parameters for Plott_UV
C
        DELTA_T         =   0           !in minutes for generation of filenames
                                        !DELTA_T = 0: No gen. of filenames
        FOUR_FIGURES    = .FALSE.       !.true. = 4 figures on 1 page

        !Scaling for length of plotted vectors, scaling = 1/(4*SKU_FAC)
        !i.e. SKU_FAC = 0.5  good length for 0.5 m/s
        !i,e. SKU_FAC = 2.5  good length for 0.1 m/s
        SKU_FAC         =  0.5
        !
C       WIND            = .TRUE.        !.true. = Process Wind file
        WIND            = .FALSE.       !.true. = Process Wind file
        !Directory for wind data
	WIND_DIR	= '/home/wera/where-ever/'
	!
	COAST		= .TRUE.	!.true. = plot coast lines
	!Name of coast line file
        COAST_DIR	= '/home/wera/coastlines/'
	!
        TEMP            = .FALSE.       !.true. = Plot surface temperature
C       TEMP            = .TRUE.        !.true. = Plot surface temperature
	!Name of temperature file
	TEMP_NAME	= '/home/wera/where-ever/Temp_Nice.dat'
        !
        TOPO            = .FALSE.       !.true. = Plot topography
C       TOPO            = .TRUE.        !.true. = Plot topography
	!Name of topography file
	TOPO_NAME	= '/home/wera/where-ever/Topo_Nice.dat'
	!
        !Name of ship 'rails'
	RAIL_NAME       = '/home/wera/etc/rail_ouessant.dat'
        !
	KM_NM_X		= 0.065		!KM_NM_Scale upper right corner
	KM_NM_Y		= 0.015		!KM_NM_Scale upper right corner
	!
c	KM_NM_X		= 0.065		!KM_NM_Scale lower right corner
c	KM_NM_Y		= 0.890		!KM_NM_Scale lower right corner
	!
C	WERA
C
	SC_COL_X        = 0.200         !Color scale position X
	SC_COL_Y        = 0.015         !Color scale position Y
        !
C	Envisat & MeteoFrance model
C
c	SC_COL_X        = 0.020         !Color scale position X
c	SC_COL_Y        = 0.015         !Color scale position Y
        !
        SC_CURR_X       = 0.070         !Scale vector position X
        SC_CURR_Y       = 0.055         !Scale vector position Y
        !
C	BKG_LEGEND	= .FALSE.	!.true. = write background legend
	BKG_LEGEND	=.TRUE.		!.true. = write background legend
	BKG_LEG_X	= 0.565
	BKG_LEG_Y	= 0.952
	!
        WRITE_COPYRIGHT = .TRUE.        !.true. = write Copyright notice
C       WRITE_COPYRIGHT = .FALSE.       !.true. = write Copyright notice
        TEXT_COPYR = '©2004 University of Hamburg, Institute of Oceanography'

        WRITE_TABLE     = .TRUE.        !.true. = write table of measurements
C       WRITE_TABLE     = .FALSE.       !.true. = write table of measurements
C       WRITE_TIME      = .TRUE.        !.true. = write figure generation time
        WRITE_TIME      = .FALSE.       !.true. = write figure generation time
        GRAY_SCALE      = .FALSE.       !.true. = use gray scale
        WH              = 1.0           !amount of white in colour (0.0 to 5.0)

C       Define the 4 edges of the map
C

C	WERA
	WEST            =  7.50000
	EAST            =  9.69000
	NORTH           = 44.05000
	SOUTH           = 42.35000

C	Envisat & Model
c	WEST            =  5.50000
c	EAST            = 11.00000
c	NORTH           = 44.50000
c	SOUTH           = 40.50000

C------------------------------------------------------------------------------
C
C	For each of the 1 to NST sites, provide SITE_nnn etc.
C	SITE_001 to SITE_012 are currently supported.
C
        SITE_001        = 'Capo Grosso'	!Site name (max 11 chars)
        LEFT_001        = .FALSE.       !Plot name to the left
	TLNG_001	= 25.0		!Length of name in map [mm]
        LATD_001        = 43.0          !LAT degrees
        LATM_001        =  0.089	!LAT minutes
        LOND_001        =  9.0          !LON degrees
        LONM_001        = 21.328	!LON minutes
        T_NO_001        =  35.0         !True_North of RX antenna
	RAN1_001        =  75.0         !Inner range
	RAN2_001        = 130.0         !Outer range

        !The following 6 parameters allow simultaneous use of a linear and
        !a square array within the same WERA system. They provide a mapping
        !of receiver channels to antenna numbers. A value of '0' indicates that
        !this antenna configuration does not exist in the actual WERA system.
        !
        ARR1_001        =  1            !First antenna# in linear array
        ARR2_001        = 16            !Last antenna# in linear array
	STEER_001	= 70		!+/- max steering angle [degrees]
        SQA1_001        =  0            !Antenna 1 of square array
        SQA2_001        =  0            !Antenna 2 of square array
        SQA3_001        =  0            !Antenna 3 of square array
        SQA4_001        =  0            !Antenna 4 of square array

	ARRD_001        = 9.35          !Distance between elements [meter]
					!Name of file for FullCalibration
	FCAL_001        = 'capogrosso.fullcal'

        !Direction finding geographical angle clockwise
        ANG1_001        =   0.0         !Direction finding from degrees
        ANG2_001        =   0.0         !Direction finding to degrees

C------------------------------------------------------------------------------
C
        SITE_002        = 'LaRevellata' !Site name (max 11 chars)
        LEFT_002        = .FALSE.       !Plot name to the left
	TLNG_002	= 23.0		!Length of name in map [mm]
        LATD_002        = 42.0          !LAT degrees
        LATM_002        = 34.714 	!LAT minutes
        LOND_002        =  8.0          !LON degrees
        LONM_002        = 43.151	!LON minutes
        T_NO_002        =  55.0         !True_North of RX antenna
	RAN1_002        =  75.0         !Inner range
	RAN2_002        = 130.0         !Outer range

        !The following 6 parameters allow simultaneous use of a linear and
        !a square array within the same WERA system. They provide a mapping
        !of receiver channels to antenna numbers. A value of '0' indicates that
        !this antenna configuration does not exist in the actual WERA system.
        !
        ARR1_002        =  1            !First antenna# in linear array
        ARR2_002        = 16            !Last antenna# in linear array
	STEER_002	= 70		!+/- max steering angle [degrees]
        SQA1_002        =  0            !Antenna 1 of square array
        SQA2_002        =  0            !Antenna 2 of square array
        SQA3_002        =  0            !Antenna 3 of square array
        SQA4_002        =  0            !Antenna 4 of square array

	ARRD_002        = 9.35          !Distance between elements [meter]
					!Name of file for FullCalibration
	FCAL_002        = 'larevellata.fullcal'

        !Direction finding geographical angle clockwise
        ANG1_002        =   0.0         !Direction finding from degrees
        ANG2_002        =   0.0         !Direction finding to degrees

C------------------------------------------------------------------------------
C
	NINST		= 1		!Number of instruments

	ILAT_001	= 43.4		!LAT of instrument
	ILON_001	=  7.8		!LON of instrument
	INAM_001	= 'Bouee'	!Name of instrument

C------------------------------------------------------------------------------
C
	LNAMES		= 9		!Number of location names

	LLAT_001	= 43.65833	!LAT of location
	LLON_001	=  7.21667	!LON of location
	LNAM_001	= 'Nice'	!Name of location

	LLAT_002	= 42.545	!LAT of location
	LLON_002	=  8.757	!LON of location
	LNAM_002	= 'Calvi'	!Name of location

	LLAT_003	= 42.675	!LAT of location
	LLON_003	=  9.448	!LON of location
	LNAM_003	= 'Bastia'	!Name of location

	LLAT_004	= 41.918	!LAT of location
	LLON_004	=  8.762	!LON of location
	LNAM_004	= 'Ajaccio'	!Name of location

	LLAT_005	= 43.535	!LAT of location
	LLON_005	= 10.314 	!LON of location
	LNAM_005	= 'Livorno'	!Name of location

	LLAT_006	= 43.783	!LAT of location
	LLON_006	=  7.642	!LON of location
	LNAM_006	= 'Menton'	!Name of location

	LLAT_007	= 43.840	!LAT of location
	LLON_007	=  7.940	!LON of location
	LNAM_007	= 'San Remo'	!Name of location

	LLAT_008	= 43.117	!LAT of location
	LLON_008	=  5.917	!LON of location
	LNAM_008	= 'Toulon'	!Name of location

	LLAT_009	= 44.117	!LAT of location
	LLON_009	=  9.833	!LON of location
	LNAM_009	= 'La Spezia'	!Name of location

	LLAT_010	= 43.300	!LAT of location
	LLON_010	=  5.400	!LON of location
	LNAM_010	= 'Marseille'	!Name of location
C	------------------------------------------------------------------------
|
The following box shows a typical output generated by Plott_UV:
wera@ifmpc225:~/Fortran> ./Plott_UV -h *** Reading configuration from /home/wera/etc/params.cfg Plott_UV 1.7.0 -f=/path/to/file/name -c=/path/to/params_xxx.cfg -b=/path/to/background/file/name -o=/path/to/output_figure/file/name -d= 0 ................. Just the map -d= 1 ............. Site coordinates -d= 2 ............. Measurement grid -d= 3 .... Geometric accuracy [GDOP] -d= 4 . Radial components of current -d= 5 .............. Current vectors -d= 6 .. Accuracy of current vectors -d= 7 ..... Coloured current vectors -d= 8 ........ Current model vectors -d= 9 ....... Significant waveheight -d=10 ..... Wind speed and direction -d=11 .................. Ship tracks -d=12 ............... Ship locations -d=13 ............ .crad Power Level -d=14 ............ .crad Noise Level -d=15 ............ .crad Power/Noise wera@ifmpc225:~/Fortran> Plott_UV -d=4 -f=/home/wera/data/examples/20022511550_kna.rad_beam X Display [X], PostScript [P], GIF [G] -> x Enter <CR> to continue. |
|
[-c=xxx is optional, ~/etc/params.cfg is the default] [-b=xxx is optional, used to display data in the background] [-o=xxx is optional, used to pass the name of the .ps, .gif figure] |
Here are examples for the selections:
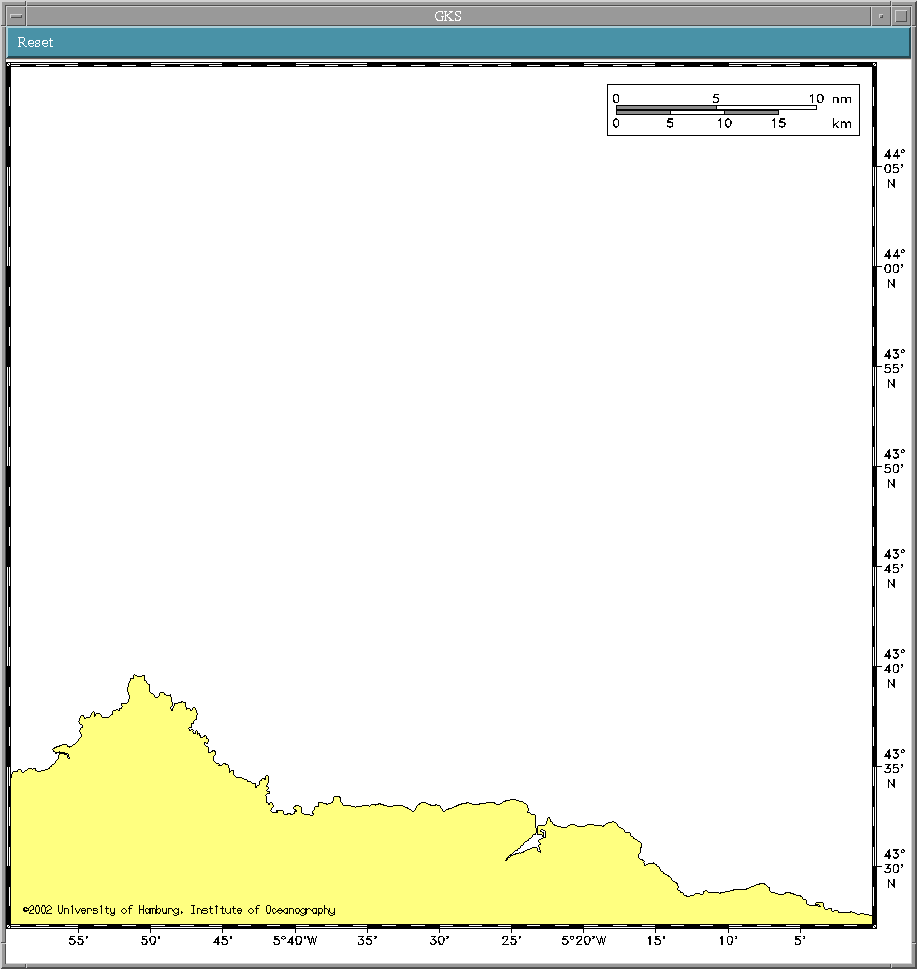
-d=0
-d=1
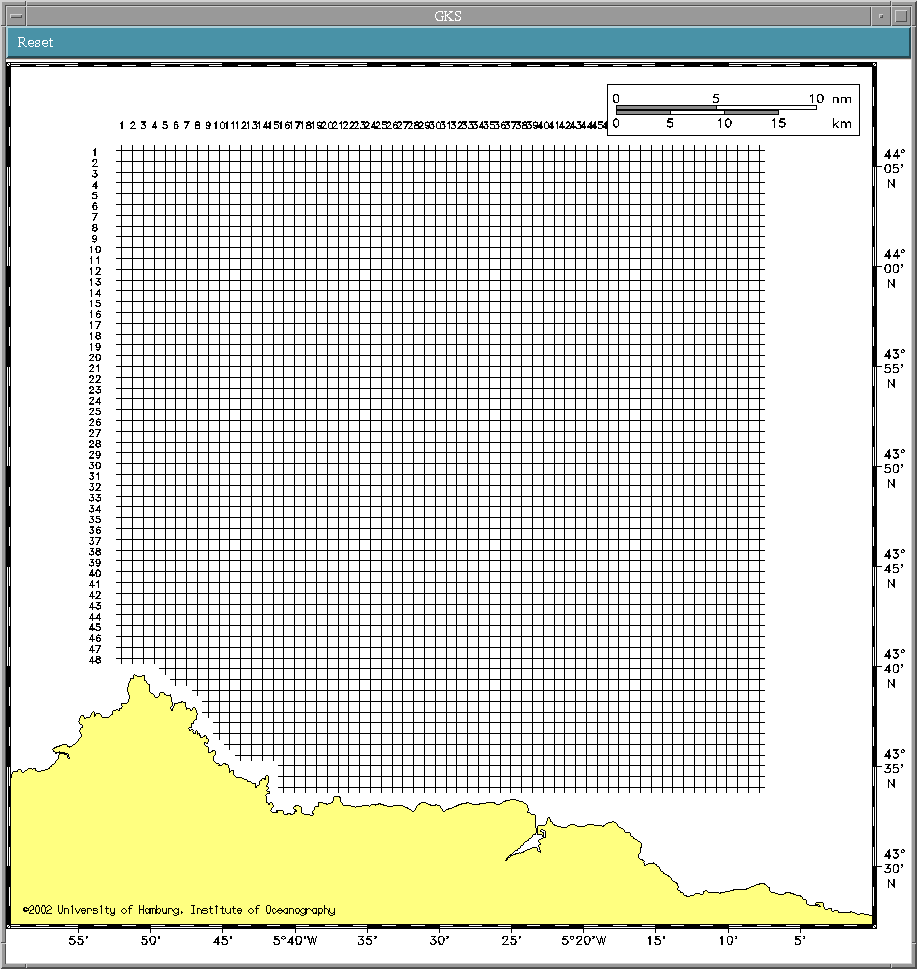
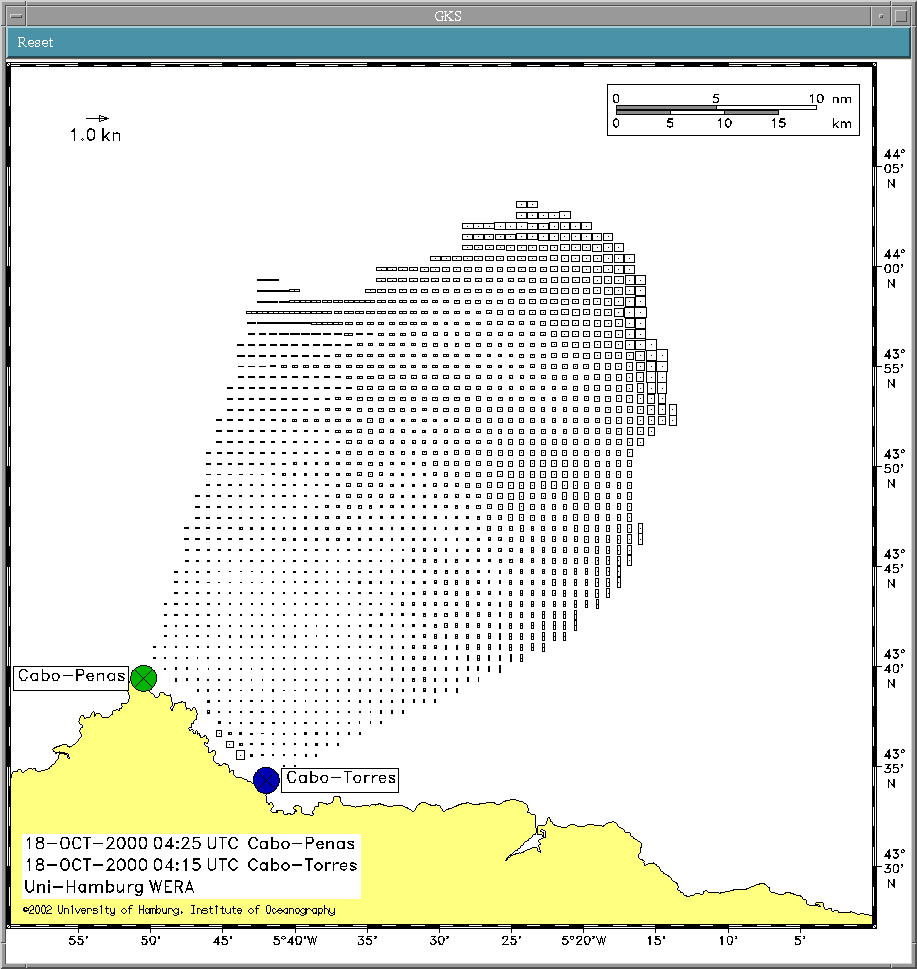
-d=2
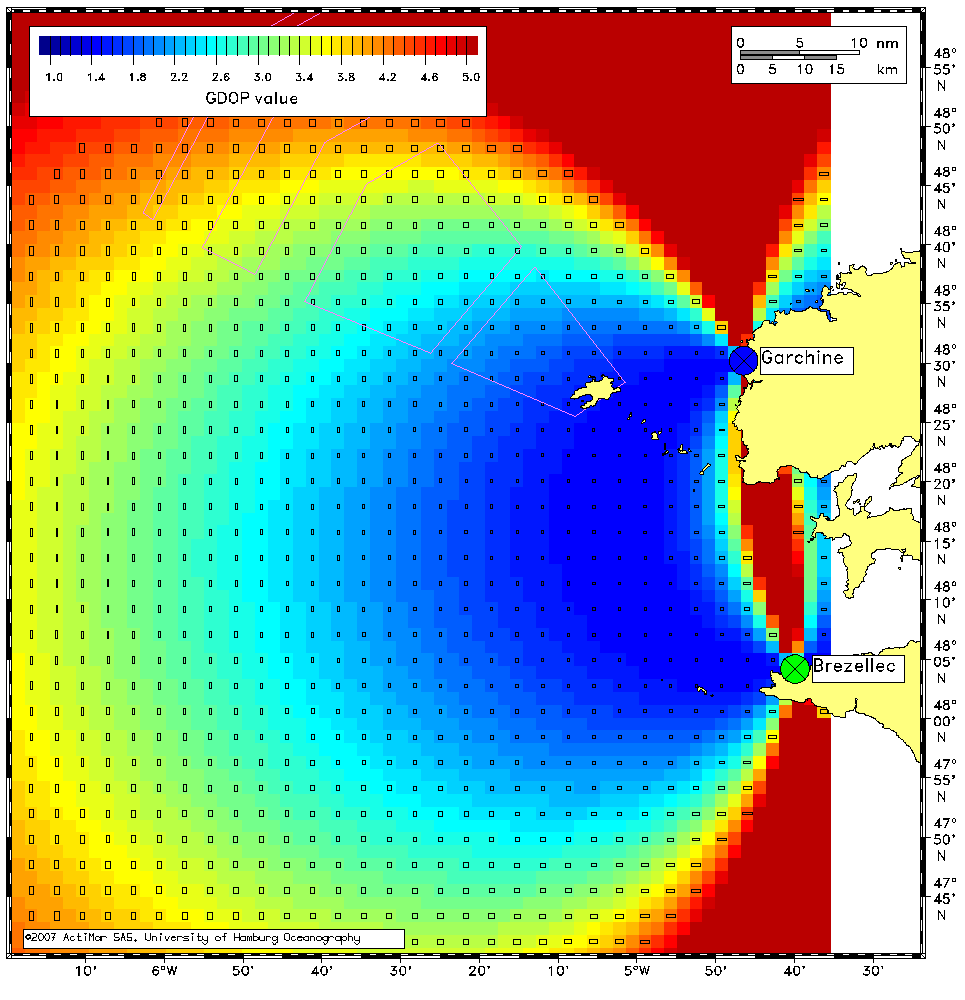
-d=3
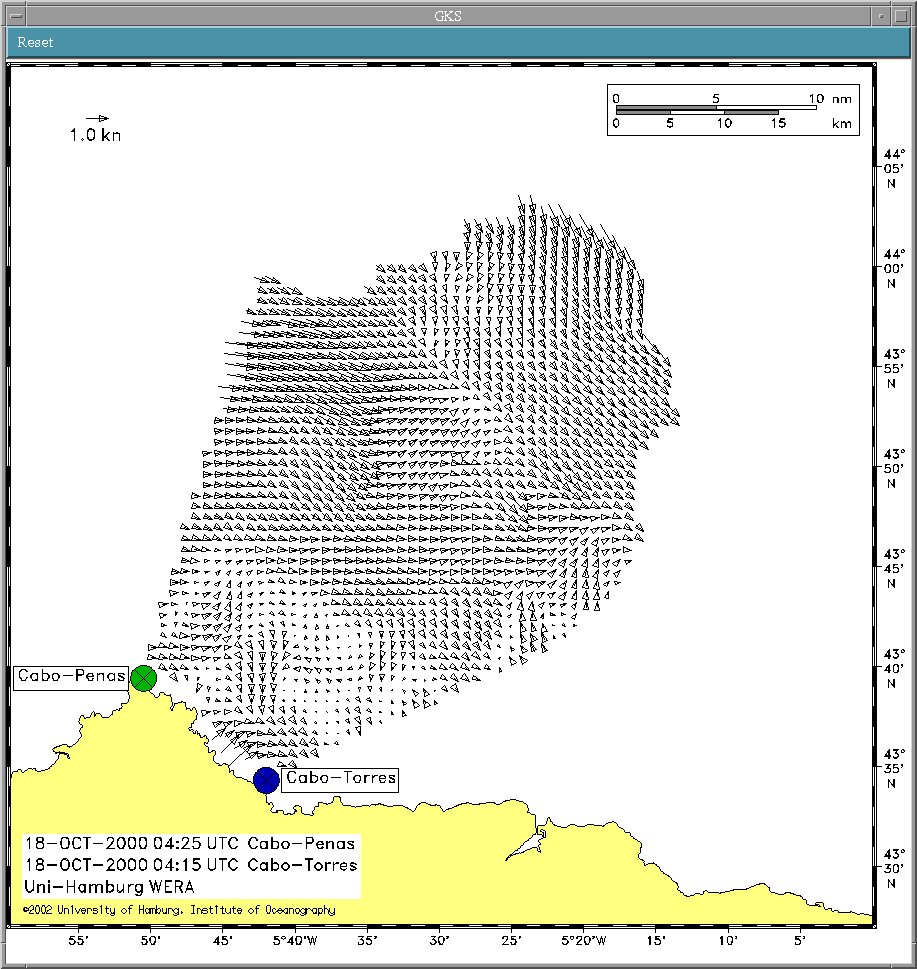
-d=4
-d=5
-d=6
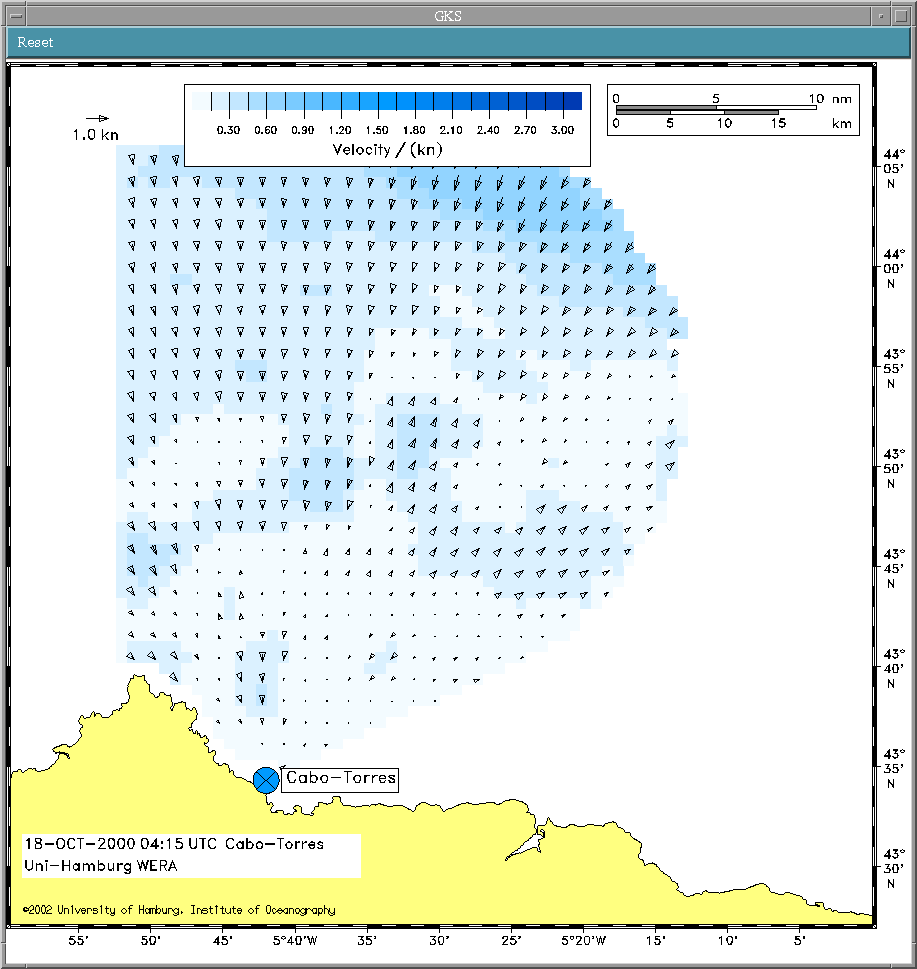
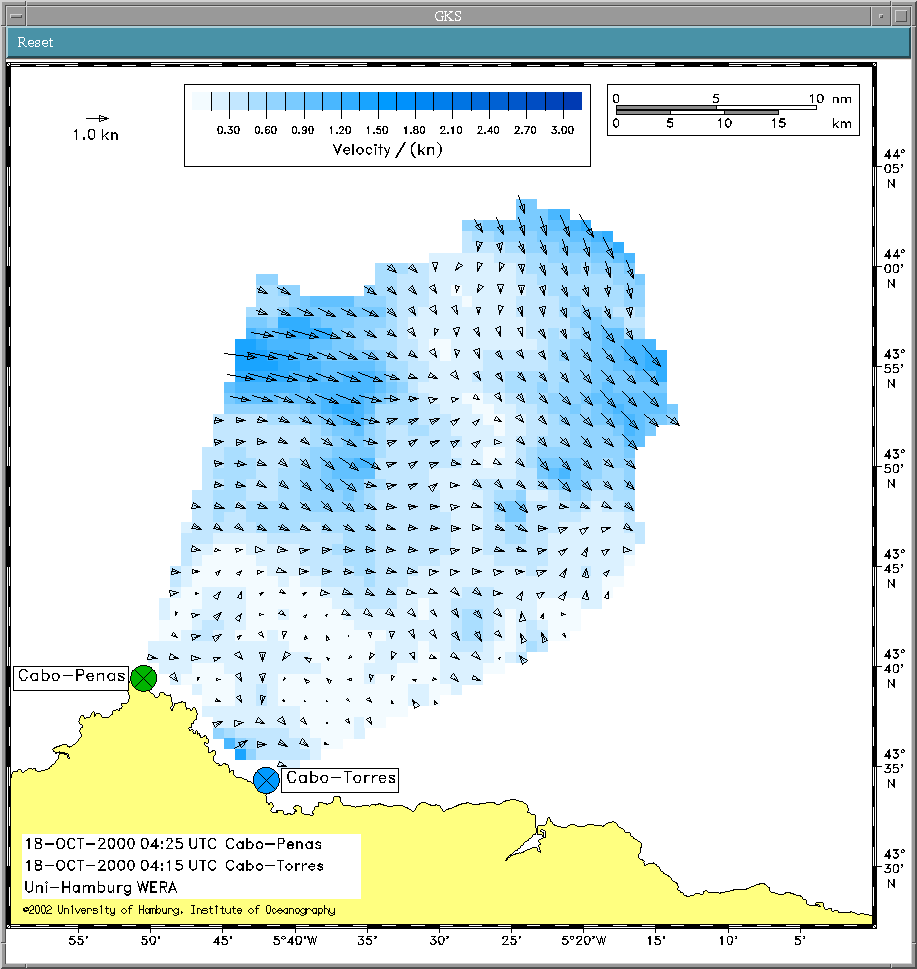
-d=7
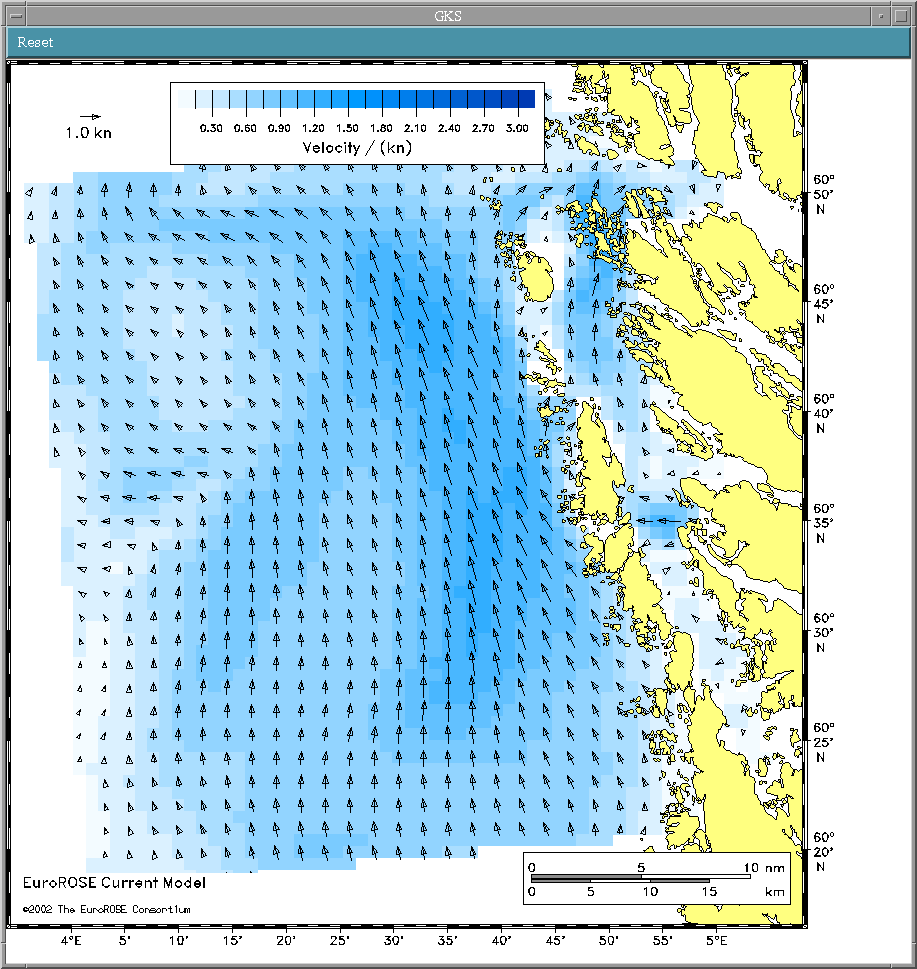
-d=8
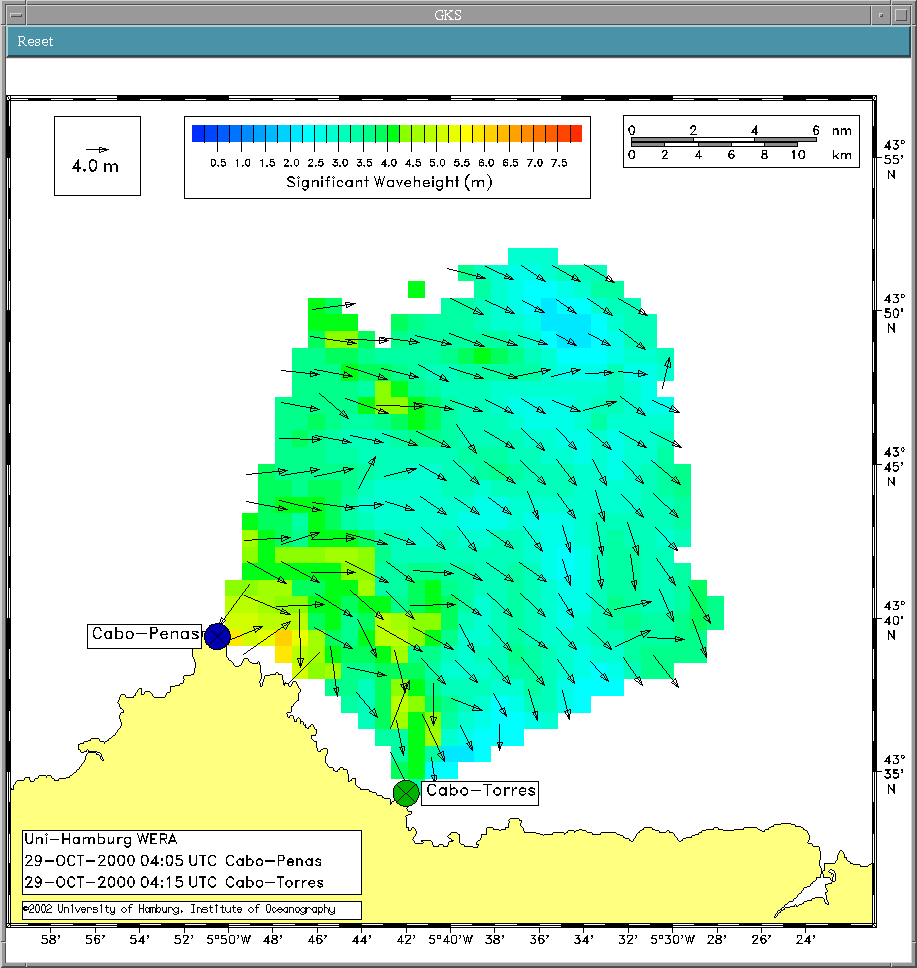
-d=9
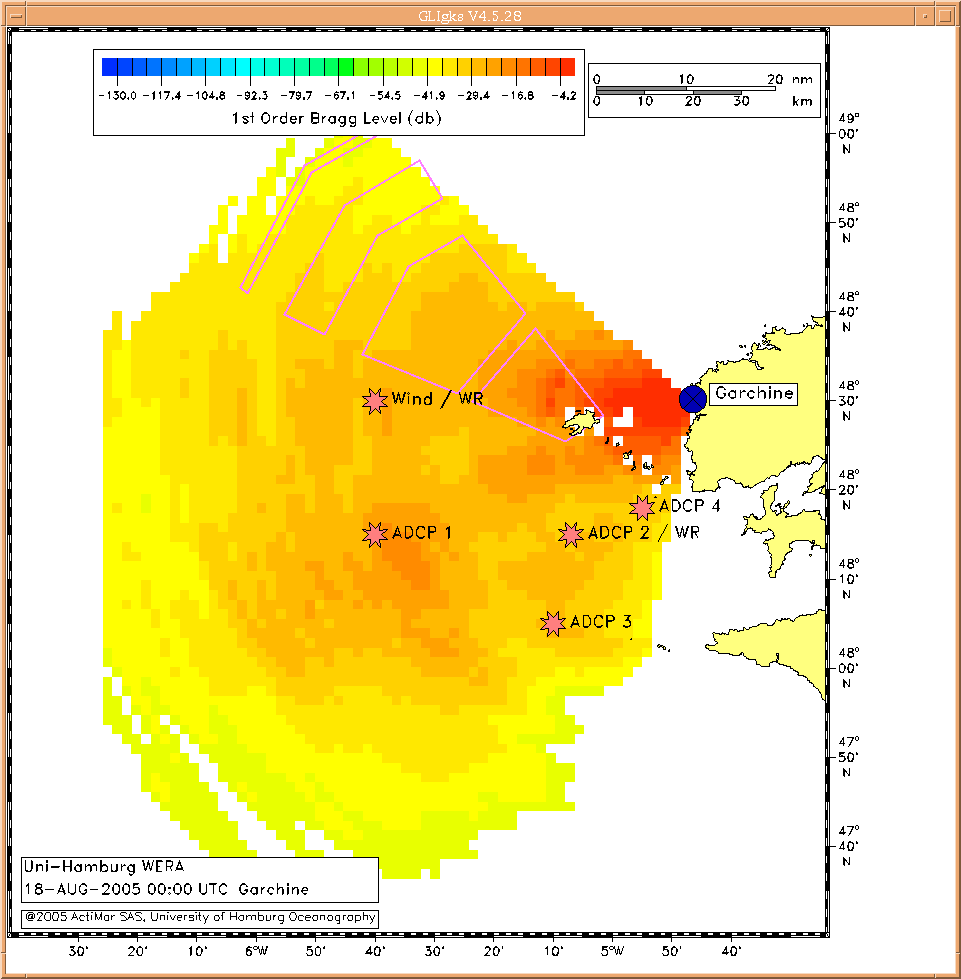
-d=13
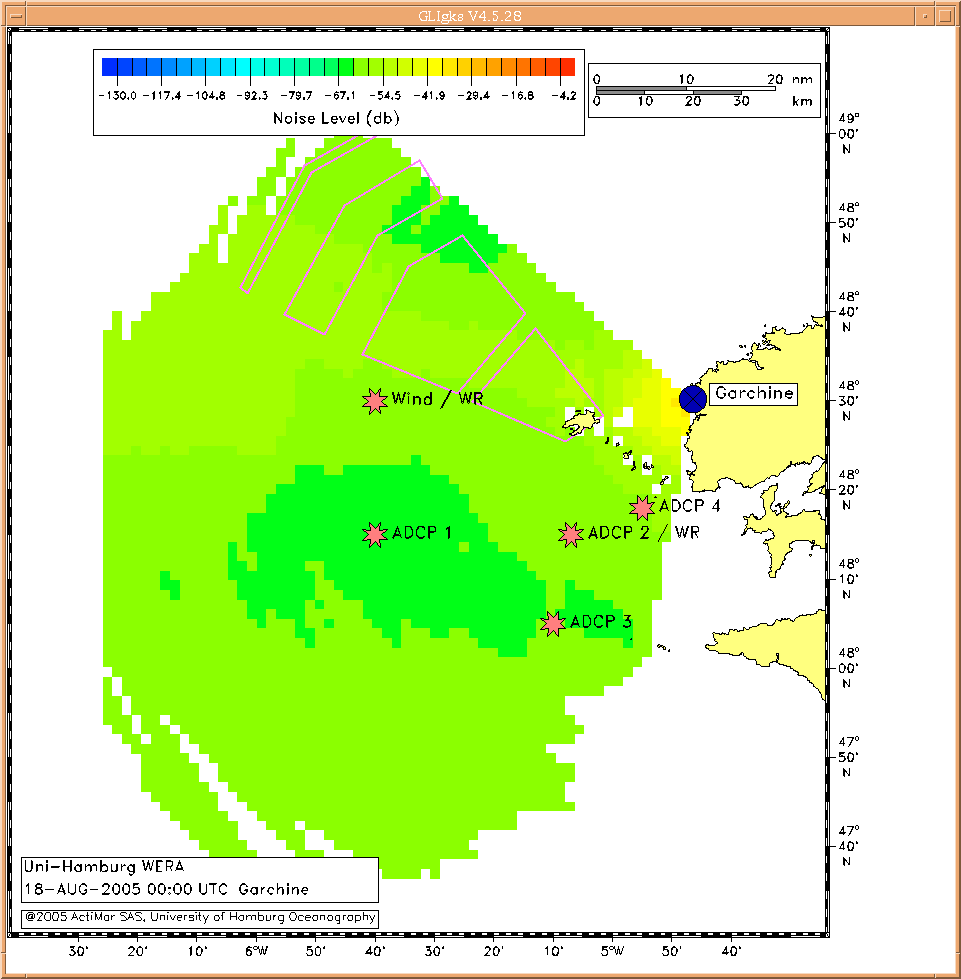
-d=14
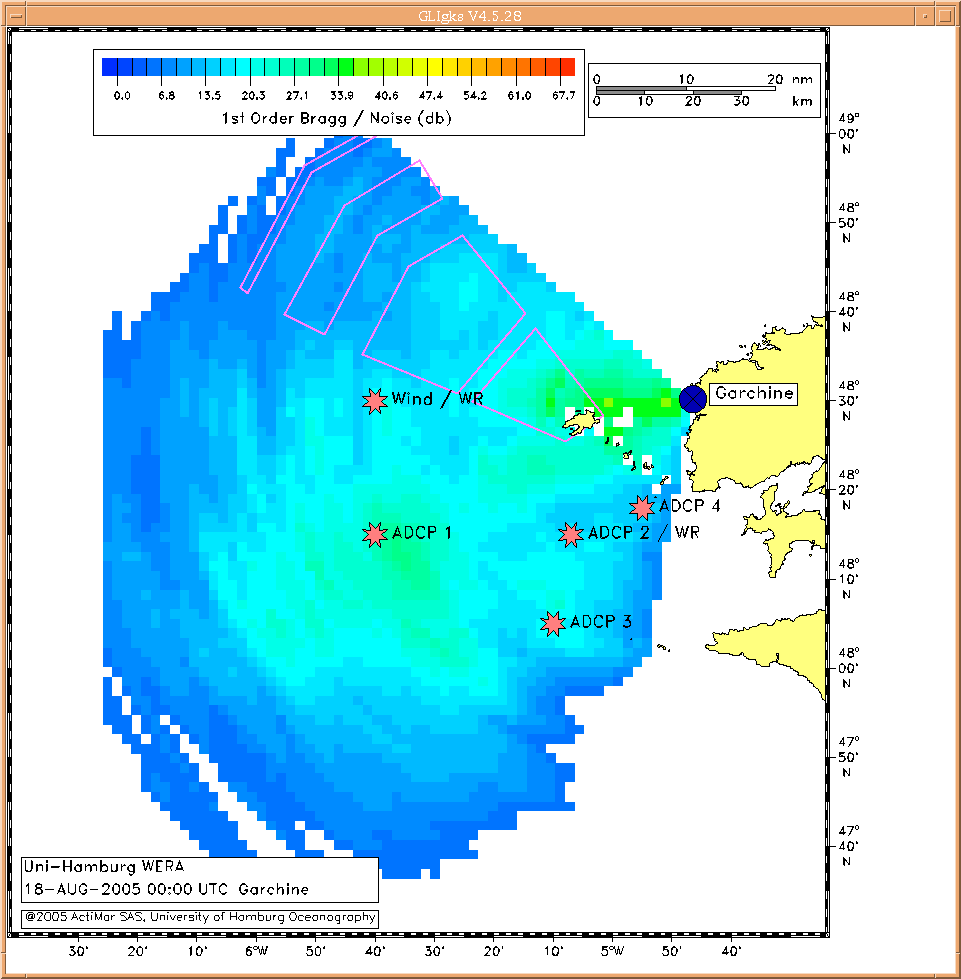
-d=15 .
You must pass the correct files or data sets to Plott_UV:
(Note, that Plott_UV can not display *.wrad data;
please pass them through wrad2uv first.)
| Selection | Description | File Name | Data Format (Overview) | Program |
|---|---|---|---|---|
| -d= 0 | Area Map | -c=xxx | params.cfg | ASCII Editor |
| -d= 1 | Site Coordinates | -c=xxx | params.cfg | ASCII Editor |
| -d= 2 | Measurement Grid | In params.cfg | Make_Grid | |
| -d= 3 | GDOP | In params.cfg | Generated by rad2uv when setting WRITE_GDOP in params.cfg to .TRUE. | |
| -d= 4 | Radial Component of Current | *.crad *.RAD_beam *.RAD_dsqu *.ruv [NOAA] |
(Beam Forming to grid) (Beam Forming, linear array) (Direction Finding, square array) |
wera16_grid / wera16_spec_cwrad wera16_beam wera4_dir |
| -d= 5 | 2-dim Current Vectors | *.cur_asc | (2-dim Vectors) | rad2uv |
| -d= 6 | 2-dim Current Vectors | *.cur_asc | (2-dim Vectors) | rad2uv |
| -d= 7 | 2-dim Current Vectors | *.cur_asc | (2-dim Vectors) | rad2uv |
| -d= 8 | Model Current Vectors | current.*.asc | (Model: 2-dim Vectors) | Numerical Model |
| -d= 9 | Significant Waveheight | *.wav_asc | (Wave) | wrad2uv |
| -d=10 | Wind Direction | *.win_asc | (Wind) | wrad2uv |
| -d=11 | Ship Tracks | |||
| -d=12 | Ship locations | |||
| -d=13 | Power Level of Radial Components | *.crad | (Beam Forming to grid) | wera16_grid / wera16_spec_cwrad |
| -d=14 | Noise Level of Radial Components | *.crad | (Beam Forming to grid) | wera16_grid / wera16_spec_cwrad |
| -d=15 | Power/Noise Level of Radial Components | *.crad | (Beam Forming to grid) | wera16_grid / wera16_spec_cwrad |
Linux: Source is in Plott_UV.F and a number of subroutines. Compilation and linking with '. do_plott_uv.sh' Compilation and linking with '. do_X11R6_plott_uv.sh' > Plott_UV -d=n -f=xxx [-c=xxx] [-b=xxx] [-o=xxx] |
VMS: Source is in Plott_UV.F and a number of subroutines. Compilation and linking with @Plott_UV $ Plott_UV -d=n -f=xxx [-c=xxx] [-b=xxx] [-o=xxx] |