| https:///weradocs/Plott_WERA_Sort_RCs.shtml |
A second optional parameter can be used to pass the name of a configuration file. This file must be located in ~/etc e.g. ~/etc/params_Hawaii.cfg . If no optional parameter is supplied, the configuration is read from ~/etc/params.cfg .
Plott_WERA_Sort_RCs can be used to check if the calibration values calculated by Plott_WERA_Cal_lsq are applied correctly. After finishing the calibration measurements, running Plott_WERA_Cal_lsq and copying the calibration values to /home/wera/etc/calibration.wera, a normal single acquisition should be started with the calibration box still connected and the frequency offset still set to e.g. 80 Hz. Ignore the warning: 'Frequency offset greater zero and normal measurement' from WeraDesk. Running Plott_WERA_Sort_RCs on the data set acquired in this way will give a table of phases for the strongest signal (which is the calibration signal), which should be close to zero due to the calibration applied. The phases calculated for the direct path signal (range cell 2 and 3) do not give useful information in this context.
To check the signals from the antennas for normal (ocean backscatter) measurements, please use Plott_WERA_Sort_RCs_Gain which compensates the WERA "Gain Ramp" (the influence of the high pass filter in front of A/D conversion).
Plott_WERA_Sort_RCs reads all information needed on number of channels, length of timeseries, etc. from the header (first 512 bytes of data file). The following box shows a typical output generated by Plott_WERA_Sort_RCs:
wera@ifmpc205:~/Fortran> Plott_WERA_Sort_RCs ~/data/examples/20020601530_hmb.sort Plott_WERA_Sort_RCs V1.3.5 Linux: Processing file: /home/wera/data/examples/20020601530_hmb.sort Frequency = 27.6499996 MHz NSER = 2048 Samples T_chirp = 0.260000 s F_bragg = 0.536471 Hz Last RC = 128 range cells RANGEresol = 1.2028 km RAN_OFF = 0.5000 RC TRUE_NORTH = 180 degrees Max signal (> range cell 4) at antenna 15 range cell 21 0.766 Hz: Antenna: Phase: Peak-1 Peak Peak+1 1 0.000 0.000 0.000 2 0.067 0.067 0.067 3 0.059 0.059 0.059 4 0.094 0.094 0.094 5 0.026 0.026 0.026 6 0.029 0.029 0.030 7 0.056 0.060 0.063 8 0.025 0.025 0.025 9 0.013 0.012 0.012 10 0.021 0.021 0.021 11 0.020 0.020 0.020 12 0.032 0.032 0.032 13 0.034 0.034 0.034 14 0.000 0.000 0.000 15 0.049 0.049 0.049 16 0.036 0.036 0.036 Direct Path at range cell 2 Antenna: Phase: Peak-1 Peak Peak+1 1 0.000 0.000 0.000 2 -39.451 -39.434 -39.359 3 -10.037 -10.731 -10.873 4 -30.202 -30.134 -30.050 5 -20.126 -20.297 -20.289 6 -16.158 -16.600 -16.544 7 -21.534 -22.648 -22.734 8 -18.471 -19.800 -19.930 9 -46.647 -46.021 -46.020 10 -115.735 -115.906 -115.717 11 7.803 7.790 7.728 12 -67.776 -67.353 -67.257 13 -33.684 -33.753 -33.791 14 -28.247 -31.624 -32.944 15 71.972 72.203 72.415 16 -44.571 -44.127 -44.084 Direct Path at range cell 3 Antenna: Phase: Peak-1 Peak Peak+1 1 0.000 0.000 0.000 2 -34.050 -39.015 -39.315 3 -1.901 -10.108 -10.774 4 -27.295 -29.766 -29.976 5 -15.333 -19.900 -20.309 6 -11.757 -16.378 -16.559 7 -14.931 -22.401 -22.772 8 7.094 -17.659 -19.645 9 -47.935 -46.067 -46.107 10 -104.763 -114.520 -115.352 11 15.513 8.135 7.733 12 -66.526 -67.344 -67.313 13 -26.487 -33.409 -33.776 14 -7.009 -29.637 -32.864 15 77.739 72.682 72.498 16 -42.090 -44.004 -44.089 X Display [X], PostScript [P], GIF [G] -> x Antenna number (1..16) -> 2 New graphics? [Y/N] -> n |
The output of the program gives information on:
Frequency:   WERA opearting frequency
NSER:        Number of chirps
T_chirp:     Duration of the frequency chirp [s]
F_bragg:     Doppler shift of Bragg scattering waves
Last RC:     Number of range cells

The strongest peak from all range cells and antennas is identified. This peak can e.g.
be found at antenna 15, range cell 21, +0.766 Hz. The phases relative to antenna #1
are calculated at the peak frequency and range cell.
A measurement with the same set-up used for the calibration measurement
before and with the calibration values applied should now give phases
around Zero.
-----------------------------------------------------------------------------
Phase Peak-1:  Phase relative to antenna #1 measured by FFT
               one spectral line left (negative) of the peak identified.
Phase Peak:    Phase relative to antenna #1 measured by FFT
               at the peak identified.
Phase Peak+1:  Phase relative to antenna #1 measured by FFT
               one spectral line right (positive) of the peak identified.
-----------------------------------------------------------------------------
The next two blocks give information on the direct path signal at
range cell 2 and 3.
|
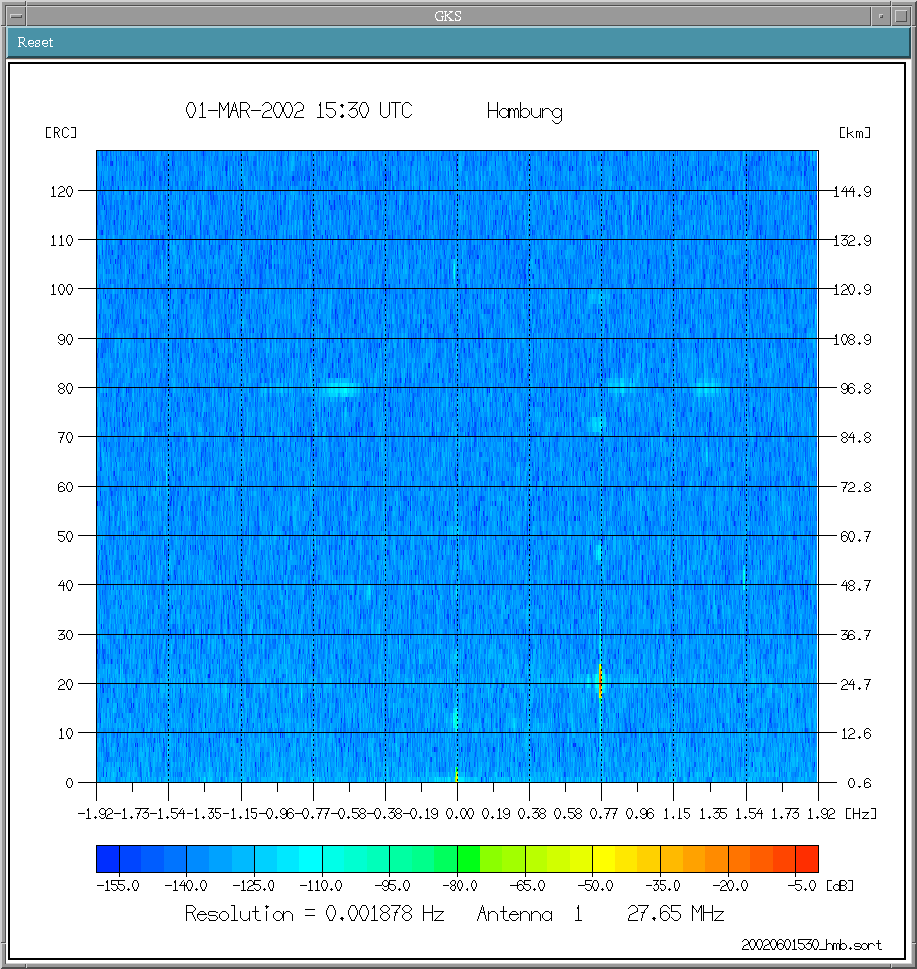
Graphics
output can be generated for each antenna channel.
The dynamic range shown in the figure has a fixed reference point: The ADC's maximum input voltage of +/-10 Volts refers to 0 dB.
Linux: Source is in Plott_WERA_Sort_RCs.F Compilation and linking with '. do_plott_wera_sort_rcs.sh' Compilation and linking with '. do_X11R6_plott_wera_sort_rcs.sh' Call with > Plott_WERA_Sort_RCs <measurement_file>.sort e.g.: > Plott_WERA_Sort_RCs ~/data/Torres/20003210115_tor.sort |
VMS: Source is in Plott_WERA_Sort_RCs.F Compilation and linking with '@Plott_WERA_Sort_RCs' Program needs to be defined as an external command to take parameters from the command line, e.g. $ Plott_WERA_Sort_RCs :== $$USER1:[WERA.Fortran]Plott_WERA_Sort_RCs.exe Call with $ Plott_WERA_Sort_RCs <measurement_file>.sort e.g.: $ Plott_WERA_Sort_RCs $DATA5:[TOR_SORT]20003210115_TOR.SORT |