| https:///weradocs/Plott_WERA_Sort_RCs_Gain.shtml |
A second optional parameter can be used to pass the name of a configuration file. This file must be located in ~/etc e.g. ~/etc/params_Hawaii.cfg . If no optional parameter is supplied, the configuration is read from ~/etc/params.cfg .
This program is similar to Plott_WERA_Sort_RCs, except that the WERA "Gain Ramp" [Gain vs. Range] (the influence of the high pass filter in front of A/D conversion) is compensated to provide normalized spectra v. range. The file name for the "Gain Ramp" is read from the configuration file ~/etc/params*.cfg .
C       ------------------------------------------------------------------------
C       ~/etc/params.cfg  Configuration for Hawaii Ocean Mixing Experiment
C       ------------------------------------------------------------------------
C
.......
C       Name of WERA Gain File
C
        GAIN_NAME       = '/home/wera/etc/wera_gain.dat'
|
Plott_WERA_Sort_RCs_Gain reads all information needed on number of channels, length of timeseries, etc. from the header (first 512 bytes of data file). The following box shows a typical output generated by Plott_WERA_Sort_RCs_Gain:
wera@ifmpc205:~/Fortran> Plott_WERA_Sort_RCs_Gain ~/data/examples/20041230320_lar.sort params_corsica.cfg Plott_WERA_Sort_RCs_Gain V1.3.5 Linux: *** Reading configuration from /home/wera/etc/params_corsica.cfg Processing file: /home/wera/data/examples/20041230320_lar.sort Frequency = 12.4770002 MHz NSER = 2048 Samples T_chirp = 0.260000 s F_bragg = 0.360374 Hz Last RC = 114 range cells RANGEresol = 1.5000 km RAN_OFF = 0.5000 RC TRUE_NORTH = 55 degrees *** FullCalib does not exist ....: larevellata.fullcal *** Reading WERA_Gain ...........: /home/wera/etc/wera_gain.dat max_gain = 28.21429 Max signal (> range cell 4) at antenna 16 range cell 6 -0.368 Hz: Antenna: Phase: Peak-1 Peak Peak+1 1 0.000 0.000 0.000 2 5.506 -2.906 -7.675 3 -17.229 -16.716 -26.523 4 -1.516 -13.735 -30.699 5 -37.474 -48.298 -72.412 6 -38.423 -30.948 -53.942 7 23.516 27.293 10.912 8 72.397 80.734 52.973 9 68.652 55.034 45.257 10 111.035 104.165 62.545 11 133.130 150.319 145.506 12 166.009 -177.431 176.672 13 -158.852 -148.481 -160.815 14 -115.523 -107.035 -122.868 15 -89.513 -83.891 -102.001 16 -60.897 -53.688 -73.072 Direct Path at range cell 2 Antenna: Phase: Peak-1 Peak Peak+1 1 0.000 0.000 0.000 2 -147.596 178.263 155.849 3 -38.246 -42.333 -61.235 4 160.293 159.004 53.811 5 27.805 30.907 70.907 6 -103.139 -91.852 -74.351 7 -141.015 -159.857 73.839 8 -141.375 -154.605 -140.907 9 -90.294 -85.633 -56.761 10 -0.002 162.025 136.337 11 -138.906 -122.631 -119.310 12 -137.300 -51.080 -5.273 13 -58.168 -176.515 145.821 14 -59.571 -84.053 -89.687 15 -176.919 -11.859 14.398 16 147.498 159.971 144.611 Direct Path at range cell 3 Antenna: Phase: Peak-1 Peak Peak+1 1 0.000 0.000 0.000 2 32.313 -170.756 147.301 3 117.354 -41.784 -66.902 4 -159.973 104.915 37.646 5 -161.531 30.448 117.590 6 48.893 -74.594 -70.436 7 130.567 159.276 47.471 8 -84.790 -162.481 -146.138 9 47.986 -74.274 -52.846 10 131.951 147.254 131.513 11 -151.266 -120.484 -119.195 12 -83.598 -21.368 -0.917 13 95.508 170.581 142.381 14 174.363 -82.882 -89.955 15 -116.233 30.092 13.897 16 -110.107 150.228 138.755 X Display [X], PostScript [P], GIF [G] -> x Antenna number (1..16) -> 1 New graphics? [Y/N] -> n |
The output of the program gives information on:
Frequency:   WERA opearting frequency
NSER:        Number of chirps
T_chirp:     Duration of the frequency chirp [s]
F_bragg:     Doppler shift of Bragg scattering waves
Last RC:     Number of range cells

The strongest peak from all range cells and antennas is identified. For a normal
measurement of ocean backscatter this peak is normally found at one of the two
first-order Bragg lines. The phases relative to antenna #1 are calculated at this
peak frequency and range cell. As the signal contains backscatter energy from all
directions, the phase calculated is quite random. There will be stable values in
case of calibration measurements.

-----------------------------------------------------------------------------
Phase Peak-1:  Phase relative to antenna #1 measured by FFT
               one spectral line left (negative) of the peak identified.
Phase Peak:    Phase relative to antenna #1 measured by FFT
               at the peak identified.
Phase Peak+1:  Phase relative to antenna #1 measured by FFT
               one spectral line right (positive) of the peak identified.
-----------------------------------------------------------------------------
The next two blocks give information on the direct path signal at
range cell 2 and 3.
|
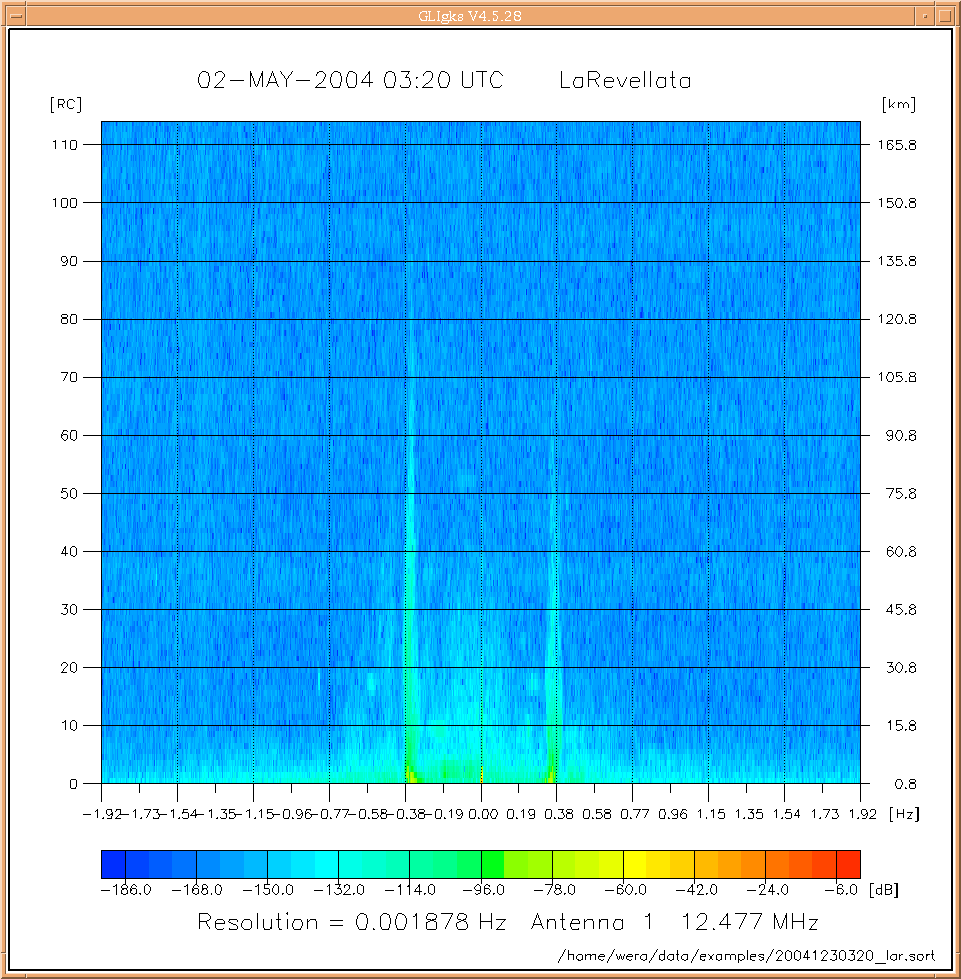
Graphics output can be generated for each antenna channel.
The dynamic range shown in the figure has a fixed reference point: The ADC's maximum input voltage of +/-10 Volts * Gain Ramp refers to 0 dB.
Linux: Source is in Plott_WERA_Sort_RCs.F (it is actually the same source for both programs; here -DGAIN is defined) Compilation and linking with '. do_plott_wera_sort_rcs.sh' Compilation and linking with '. do_X11R6_plott_wera_sort_rcs.sh' (which actually generates both execuatables) Call with > Plott_WERA_Sort_RCs_Gain <measurement_file>.sort e.g.: > Plott_WERA_Sort_RCs_Gain ~/data/Torres/20003210115_tor.sort |
VMS: Source is in Plott_WERA_Sort_RCs.F (it is actually the same source for both programs; here -DGAIN is defined) Compilation and linking with '@Plott_WERA_Sort_RCs' (which actually generates both execuatables) Program needs to be defined as an external command to take parameters from the command line, e.g. $ Plott_WERA_Sort_RCs_Gain :== $$USER1:[WERA.Fortran]Plott_WERA_Sort_RCs_Gain.exe Call with $ Plott_WERA_Sort_RCs_Gain <measurement_file>.sort e.g.: $ Plott_WERA_Sort_RCs_Gain $DATA5:[TOR_SORT]20003210115_TOR.SORT |