| https:///weradocs/Plott_WERA_Cal_lsq.shtml |
Plott_WERA_Cal_lsq reads all information needed on number of channels, length of timeseries, etc. from the header (first 512 bytes of data file). The following box shows a typical output generated by Plott_WERA_Cal_lsq:
wera@ifmpc205:~/Fortran> Plott_WERA_Cal_lsq ~/data/examples/20052111536_gar.cal Plott_WERA_Cal_lsq V1.1.5 Linux: Screen output in: /home/wera/data/examples/20052111536_gar.cal.txt Processing file: /home/wera/data/examples/20052111536_gar.cal FREQ = 12.37800 MHz t_sweep = 0.26000 s mt = 1536 samples nfft = 512 samples nant = 16 antennas i_offset = 124076836 DDS steps f_offset = -80.00000 Hz f_center = -80.00000 Hz Antenna: DC values [V]: RMS values: [V] Cal values: 1 -0.08435 -0.02620 2.81353 2.65744 1.09339 1.15762 2 0.02137 0.00873 2.91672 2.76683 1.05471 1.11185 3 -0.06040 0.01766 2.90553 2.76128 1.05877 1.11408 4 0.02025 0.00349 2.92831 2.75833 1.05054 1.11528 5 -0.04856 -0.03814 2.94791 2.75909 1.04355 1.11497 6 0.00659 0.00419 2.92583 2.76717 1.05143 1.11171 7 0.01921 0.01551 2.91332 2.78545 1.05594 1.10442 8 0.00814 -0.00109 3.07629 2.89622 1.00000 1.06218 9 0.00481 0.01805 2.96261 2.78679 1.03837 1.10388 10 0.00882 0.01344 2.93327 2.77821 1.04876 1.10729 11 0.01142 0.02336 2.93315 2.74285 1.04880 1.12157 12 -0.00058 0.01299 2.92946 2.74230 1.05012 1.12179 13 -0.00311 0.01281 2.92433 2.78664 1.05196 1.10394 14 -0.00537 0.02388 2.90608 2.75781 1.05857 1.11548 15 0.01361 0.01895 2.90061 2.73391 1.06057 1.12524 16 0.01955 0.01478 2.90615 2.69796 1.05854 1.14023 Antenna: Freq.: Phase: Peak-1 Peak Peak+1 LSQ I/Q-Balance 1 -80.00300 0.000 0.000 0.000 0.00 90.58 2 -80.00300 19.825 19.824 19.825 19.82 90.47 3 -80.00300 18.444 18.443 18.444 18.44 90.33 4 -80.00300 18.968 18.967 18.968 18.97 90.76 5 -80.00300 11.070 11.070 11.071 11.07 90.39 6 -80.00300 16.843 16.843 16.843 16.84 91.03 7 -80.00300 10.036 10.038 10.039 10.04 90.55 8 -80.00300 -3.678 -3.677 -3.677 -3.68 90.82 9 -80.00300 22.568 22.569 22.570 22.57 90.19 10 -80.00300 -44.440 -44.437 -44.437 -44.43 91.19 11 -80.00300 23.004 23.004 23.005 23.00 90.24 12 -80.00300 1.354 1.354 1.354 1.35 90.91 13 -80.00300 20.024 20.023 20.024 20.02 90.13 14 -80.00300 17.353 17.350 17.351 17.35 91.19 15 -80.00300 9.031 9.031 9.031 9.03 90.18 16 -80.00300 10.116 10.117 10.116 10.12 90.56 Calibration data in /home/wera/data/examples/20052111536_gar.cal.amphase To activate this calibration, please execute the command: > cp /home/wera/data/examples/20052111536_gar.cal.amphase ~/etc/calibration.wera Graphics [Y/N] -> n |
The output of the program gives information on:
t_sweep:      Duration of the frequency chirp [s]
mt:           Number of samples within a chirp
nfft:         Number of chirps
nant:         Number of antenna channels
i_offset:     Offset in DDS steps between receive and transmit frequency
              to generate a constant offset signal for calibration.
              124076836 DDS steps transform to -80.00000 Hz, which
              corresponds to a signal arriving from range cell 20.
f_offset:     Offset frequency calculated from i_offset.
f_center:     Center frequency for the graphics output (to be modified in
              Plott_WERA_Cal_lsq.F).

A list of DC values, RMS values and Cal values follows for each antenna:
------------------------------------------------------------------------
DC values  [V]: DC measured from the I and Q channels in Volts
RMS values [V]: RMS of signal measured from the I and Q channels in Volts
Cal values    : Multiply each channel with this value to compensate for
                gain differences. (Needed for the calibration file)

A list of Peak frequency, Phases relative to antenna #1 and I/Q balance follows:
--------------------------------------------------------------------------------
Freq.:         Peak frequency identified by a FFT.
Phase Peak-1:  Phase relative to antenna #1 measured by FFT
               one spectral line left (negative) of the peak identified.
Phase Peak:    Phase relative to antenna #1 measured by FFT
               at the peak identified.
Phase Peak+1:  Phase relative to antenna #1 measured by FFT
               one spectral line right (positive) of the peak identified.
LSQ:           Phase relative to antenna #1 measured by a Least Squares Fit.
	       This value is used during normal measurements to force back all
               channels to pase Zero. (Needed for the calibration file)
I/Q-Balance:   Phase difference between I and Q, should be 90 degrees.
|
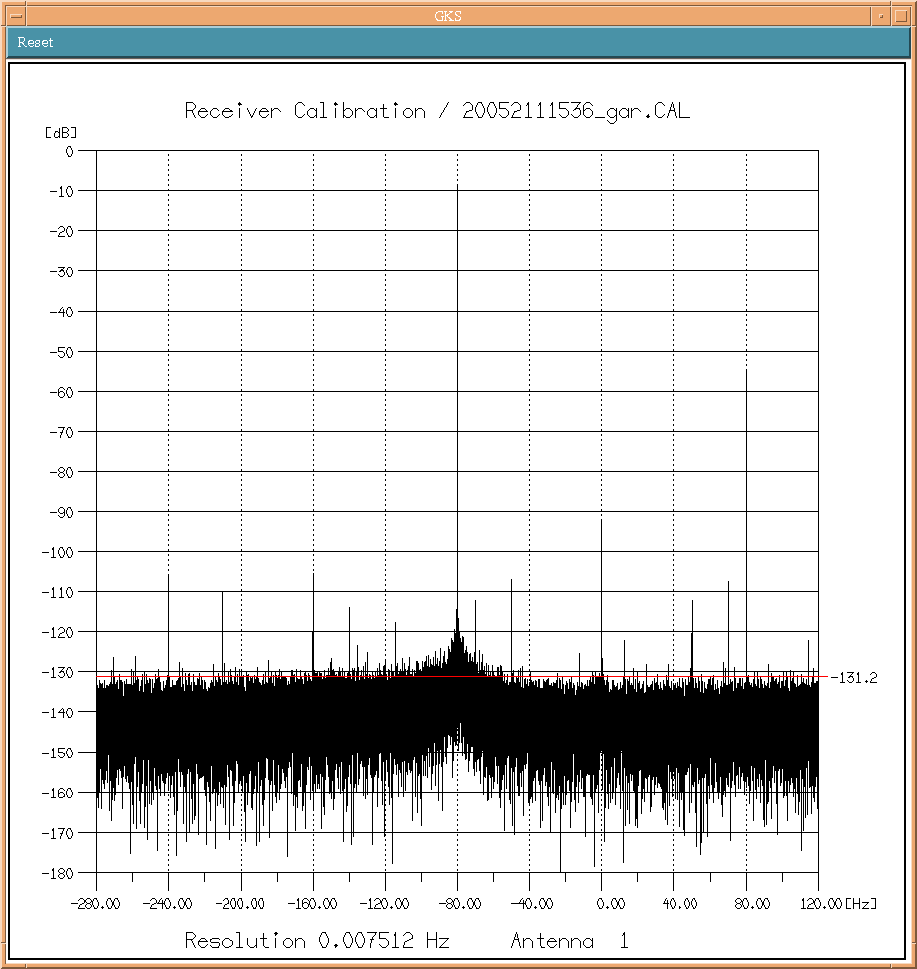
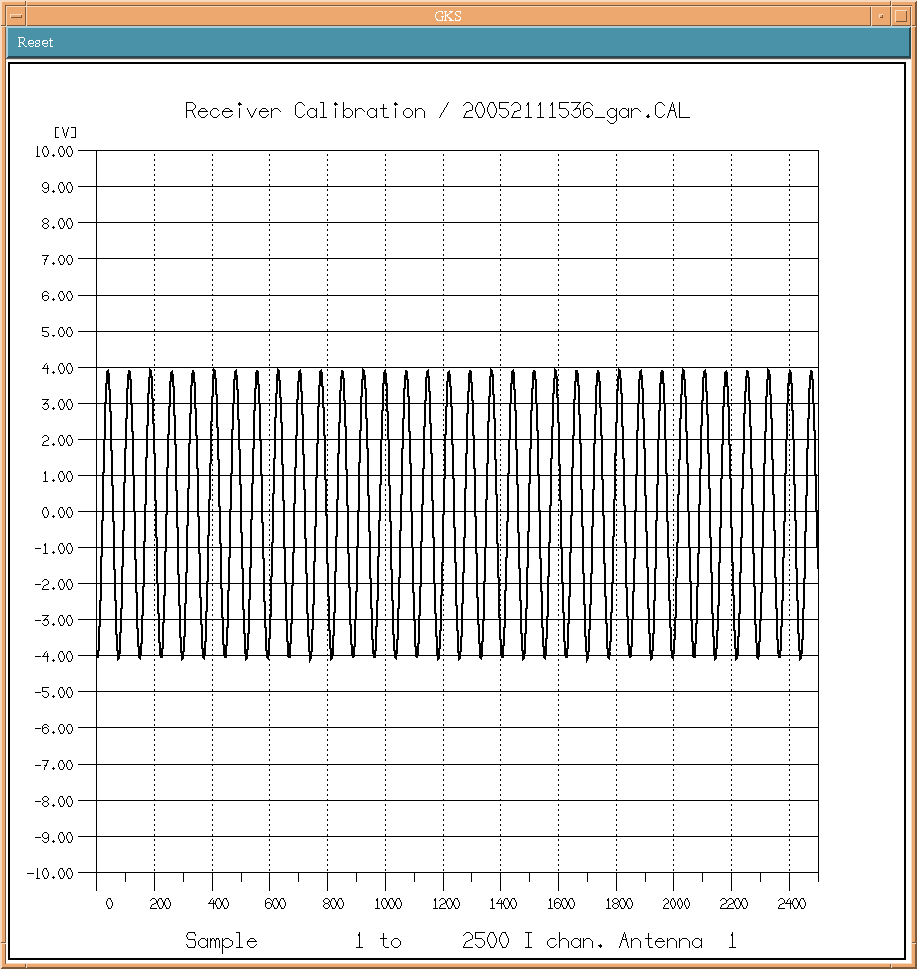
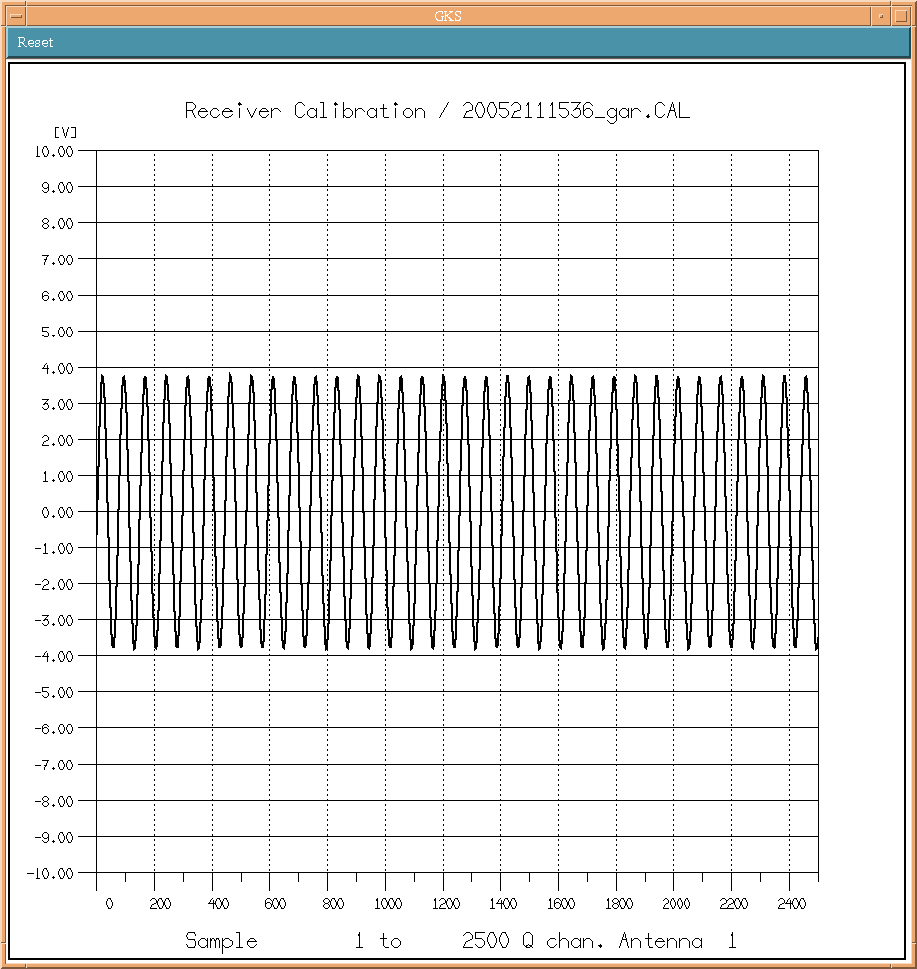
Graphics output can be generated for each antenna channel and
can be shown.
Linux: Source is in Plott_WERA_Cal_lsq.F Compilation and linking with '. do_plott_wera_cal_lsq.sh' Compilation and linking with '. do_X11R6_plott_wera_cal_lsq.sh' Call with > Plott_WERA_Cal_lsq <calibration_file>.cal e.g.: > Plott_WERA_Cal_lsq /home/wera/data/calib/20013411230_hmb.cal |
VMS: Source is in Plott_WERA_Cal_lsq.F Compilation and linking with '@Plott_WERA_Cal_lsq' Program needs to be defined as an external command to take parameters from the command line, e.g. $ Plott_WERA_Cal_lsq :== $$USER1:[WERA.Fortran]Plott_WERA_Cal_lsq.exe Call with $ Plott_WERA_Cal_lsq <calibration_file>.cal e.g.: $ Plott_WERA_Cal_lsq $DATA1:[WERA.Fortran]20013411230_hmb.CAL |