| https:///weradocs/Plott_WERA_Cross_Cal_lsq.shtml |
This is a special version of Plott_WERA_Cal_lsq which allows to select a frequency range where to look for calibration signals and compensate the additional phase shift introduced due to the geometry of the receive antenna array to the transmitter location.
If the configuration file is passed as an optional second parameter, the antenna array locations
are read from 'antpos*.asc' to calculate the phases to be subtracted from the measurement.
If the configuration file is not passed, the user can select if he wants to correct for phase shifts due
to the receive antenna array (Linear array? [Y/N] ->). If he selects "yes", he can enter the (constant) antenna spacing and
the angle relative to the array.
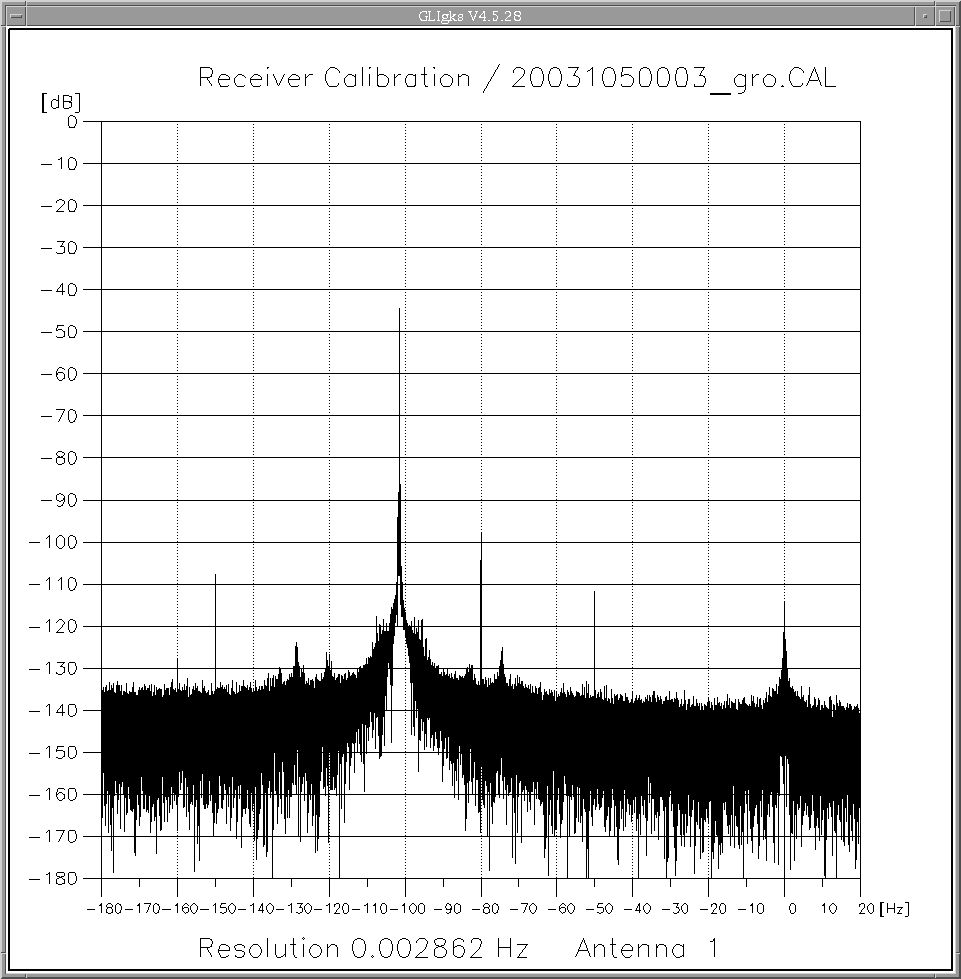
After start, Plott_WERA_Cross_Cal_lsq asks for an antenna/channel number to display the spectrum. When exiting the 'display spectrum' mode, a center offset frequency, e.g. -102.5 Hz and a bandwidth to seach for the maximum signal, e.g. 1.5 Hz can be entered.
Plott_WERA_Cross_Cal_lsq reads all other information needed on number of channels, length of timeseries, etc. from the header (first 512 bytes of data file). The following box shows a typical output generated by Plott_WERA_Cross_Cal_lsq:
IFMRO5 $ Plott_WERA_Cross_Cal_lsq $DATA4:[NURC.Palmaria.CAL]20091190814_pal.CAL Param_UV_ital.cfg Screen output in: $DATA4:[NURC.Palmaria.CAL]20091190814_pal.CAL.txt Plott_WERA_Cross_Cal_lsq V1.2.1 OpenVMS: *** Reading configuration from $user1:[wera.etc]Param_UV_ital.cfg *** Processing file: $DATA4:[NURC.Palmaria.CAL]20091190814_pal.CAL *** Using site number 1 from $user1:[wera.etc]Param_UV_ital.cfg *** Reading antenna locations from $user1:[wera.etc]antpos_palmaria.asc FREQ = 12.35000 MHz t_sweep = 0.26000 s mt = 1536 samples nfft = 1024 samples nant = 16 antennas DDS_Clock = 181.484308 MHz i_offset = 0 DDS steps f_offset = 0.00000 Hz f_center = -80.00000 Hz Antenna number (1..16) -> 1 *** Figure is displayed here. *** New graphics? [Y/N] -> n Manual frequency offset [Hz] -> -88 +/- Bandwidth to search [Hz] -> 5 man_off = -88.00000 Hz Linear array? [Y/N] -> y Location of the transmitter (ship) [LAT, LON (degrees)] -> 44.01233 9.86883 Antenna Distance->TX Distance-Ant1 Phase number [km] [m] [degrees] 1 3.7440683060 0.0000000000000 0.0000000000 2 3.7517852718 0.0077169658255 -114.3654370672 3 3.7613169431 0.0172486370977 104.3751903167 4 3.7701960671 0.0261277610888 -27.2134312963 5 3.7789436056 0.0348752996033 -156.8519560861 6 3.7884758321 0.0444075260552 61.8804435335 7 3.7975966536 0.0535283475820 -73.2901356690 8 3.8072967730 0.0632284669510 142.9540908426 9 3.8166321501 0.0725638441284 4.6037967998 10 3.8271214449 0.0830531388415 -150.8475556494 11 3.8368097276 0.0927414215863 65.5720896369 12 3.8453018053 0.1012334992533 -60.2805052756 13 3.8514662896 0.1073979835683 -151.6381656446 14 3.8569643373 0.1128960312454 126.8807652638 15 3.8632991374 0.1192308313636 32.9990246119 16 3.8705561294 0.1264878233481 -74.5495999204 Phases due to beam steering: 0.0 -114.4 104.4 -27.2 -156.9 61.9 -73.3 143.0 4.6 -150.8 65.6 -60.3 -151.6 126.9 33.0 -74.5 Antenna: DC values [V]: RMS values: [V] Cal values: 1 0.00480 0.03466 0.02393 0.02274 1.19424 1.25669 2 0.03066 0.04107 0.01916 0.01820 1.49154 1.57089 3 0.00369 0.02561 0.01730 0.01651 1.65234 1.73105 4 0.01927 0.03933 0.02029 0.01913 1.40856 1.49435 5 0.01593 0.03433 0.01870 0.01751 1.52830 1.63277 6 0.01139 0.04093 0.01915 0.01817 1.49229 1.57277 7 0.00879 0.01987 0.02297 0.02124 1.24461 1.34555 8 0.00903 0.03430 0.02028 0.01925 1.40972 1.48479 9 0.02394 0.02018 0.01968 0.01870 1.45207 1.52843 10 0.02106 0.00051 0.02084 0.01977 1.37150 1.44615 11 0.00599 0.02547 0.02016 0.01917 1.41753 1.49118 12 0.02675 0.02741 0.01917 0.01821 1.49126 1.57001 13 0.02154 0.03094 0.01717 0.01622 1.66475 1.76260 14 0.01382 0.01244 0.01711 0.01643 1.67028 1.73921 15 -0.00606 -0.00107 0.02206 0.02101 1.29575 1.36053 16 0.02375 0.03637 0.02858 0.02712 1.00000 1.05403 Antenna: Freq.: Phase: Peak-1 Peak Peak+1 LSQ I/Q-Balance 1 -88.32257 0.000 0.000 0.000 0.00 89.20 2 -88.32257 153.040 153.066 152.990 153.17 89.14 3 -88.32257 -42.842 -42.980 -43.098 -42.57 89.41 4 -88.32257 -123.084 -123.215 -123.294 -123.12 90.09 5 -88.32257 -125.840 -125.839 -125.817 -125.54 89.69 6 -88.32257 -22.144 -22.313 -22.339 -22.11 89.84 7 -88.32257 -9.105 -9.162 -9.300 -8.73 89.60 8 -88.32257 -11.234 -11.299 -11.393 -10.94 89.07 9 -88.32257 58.858 58.561 58.355 59.31 90.00 10 -88.32257 -151.250 -151.541 -151.499 -151.14 89.91 11 -88.32257 91.897 91.907 91.963 92.20 89.61 12 -88.32257 101.236 100.946 100.811 101.49 89.64 13 -88.32257 5.275 5.445 5.472 7.17 89.55 14 -88.32257 114.946 114.839 114.792 116.19 89.53 15 -88.32257 11.930 11.824 11.691 13.63 89.27 16 -88.32257 -13.787 -13.779 -13.829 -11.97 90.16 Calibration data in $DATA4:[NURC.Palmaria.CAL]20091190814_pal.CAL.amphase |
The output of the program gives information on:
t_sweep:      Duration of the frequency chirp [s]
mt:           Number of samples within a chirp
nfft:         Number of chirps
nant:         Number of antenna channels
i_offset:     Offset in DDS steps between receive and transmit frequency
              to generate a constant offset signal for calibration.
              124076836 DDS steps transform to -80.00000 Hz, which
              corresponds to a signal arriving from range cell 20.
f_offset:     Offset frequency calculated from i_offset.
f_center:     Center frequency for the graphics output (to be modified in
              Plott_WERA_Cross_Cal_lsq.F).

A list of DC values, RMS values and Cal values follows for each antenna:
------------------------------------------------------------------------
DC values  [V]: DC measured from the I and Q channels in Volts
RMS values [V]: RMS of signal measured from the I and Q channels in Volts
Cal values    : Multiply each channel with this value to compensate for
                gain differences. (Needed for the calibration file)

A list of Peak frequency, Phases relative to antenna #1 and I/Q balance follows:
--------------------------------------------------------------------------------
Freq.:         Peak frequency identified by a FFT.
Phase Peak-1:  Phase relative to antenna #1 measured by FFT
               one spectral line left (negative) of the peak identified.
Phase Peak:    Phase relative to antenna #1 measured by FFT
               at the peak identified.
Phase Peak+1:  Phase relative to antenna #1 measured by FFT
               one spectral line right (positive) of the peak identified.
LSQ:           Phase relative to antenna #1 measured by a Least Squares Fit.
	       This value is used during normal measurements to force back all
               channels to pase Zero. (Needed for the calibration file)
I/Q-Balance:   Phase difference between I and Q, should be 90 degrees.
|
Linux: Source is in Plott_WERA_Cross_Cal_lsq.F Compilation and linking with '. do_plott_wera_cross_cal_lsq.sh' Compilation and linking with '. do_X11R6_plott_wera_cross_cal_lsq.sh' Call with > Plott_WERA_Cross_Cal_lsq <calibration_file>.cal e.g.: > Plott_WERA_Cross_Cal_lsq /home/wera/data/calib/20013411230_hmb.cal |
VMS: Source is in Plott_WERA_Cross_Cal_lsq.F Compilation and linking with '@Plott_WERA_Cross_Cal_lsq' Program needs to be defined as an external command to take parameters from the command line, e.g. $ Plott_WERA_Cross_Cal_lsq :== $$USER1:[WERA.Fortran]Plott_WERA_Cross_Cal_lsq.exe Call with $ Plott_WERA_Cross_Cal_lsq <calibration_file>.cal e.g.: $ Plott_WERA_Cross_Cal_lsq $DATA1:[WERA.Fortran]20013411230_hmb.CAL |