| https:///weradocs/Plott_WERA16_Grid.shtml |
wera@ifmpc205:~/Fortran> Plott_WERA16_Grid ~/data/examples/20022921330_kna.spec Plott_WERA16_Grid V1.1.7 Linux: *** Now processing : /home/wera/data/examples/20022921330_kna.spec F_BRAGG = 0.4087299 Hz Last RC = 128 RANGEresol = 1.2000 km RAN_OFF = 0.50 RC TRUE_NORTH = 299 degrees Grid point IX [1..100] IY [1..140] --> 63 64 X Display [X], PostScript [P], GIF [G] -> x Enter <CR> to continue. |
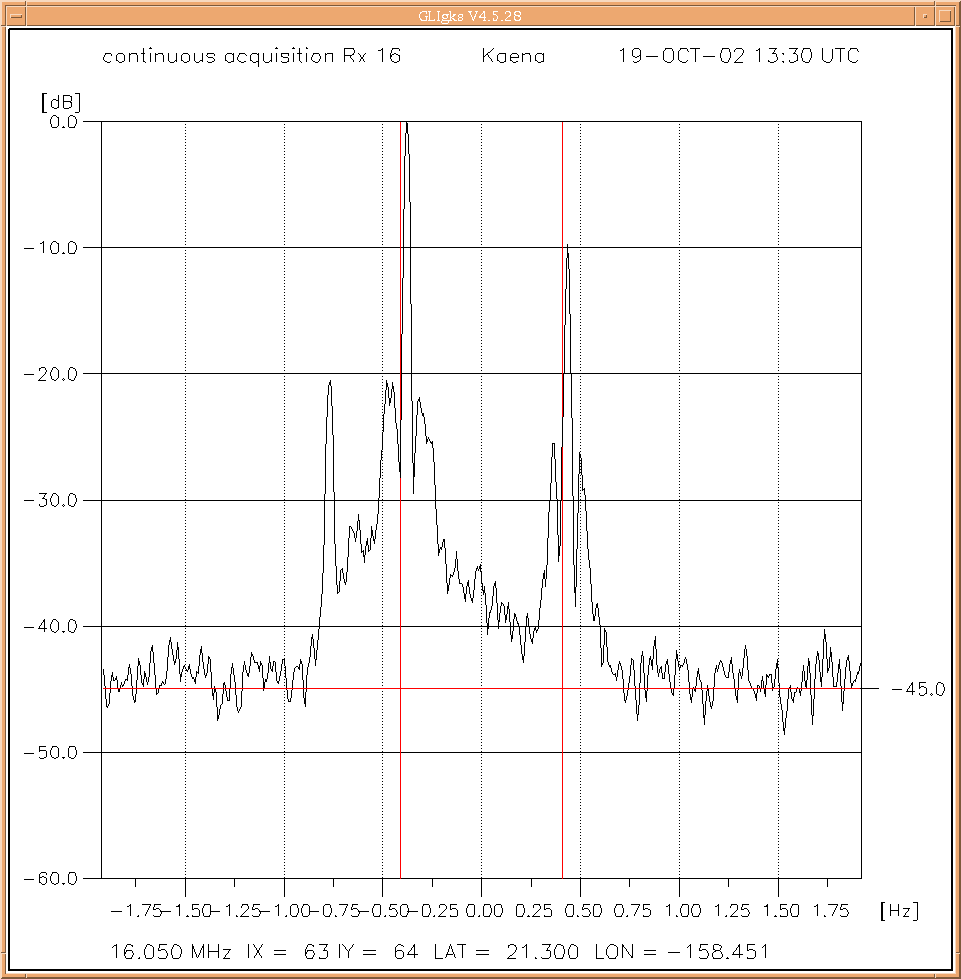
Graphics output can be generated for each selected grid point. The example shows a backscatter spectrum about 35 km off the WERA site at Kaena. Two strong first-order peaks can be seen with a slight shift to higher frequencies relative to the Bragg lines (in red). The second-order bands can also be identified left and right of the two first-order peaks. The peak at -0.75 Hz is probably due to a sailing ship. The horizontal red line markes the noise level.
Linux: Source is in Plott_WERA16_Grid.F Compilation and linking with '. do_plott_wera16_grid.sh' Compilation and linking with '. do_X11R6_plott_wera16_grid.sh' Call with > Plott_WERA16_Grid <measurement_file>.spec e.g.: > Plott_WERA16_Grid /home/wera/data/kaena/20022921330_kna.spec |
VMS: Source is in Plott_WERA16_Grid.F Compilation and linking with '@Plott_WERA16_Grid' Program needs to be defined as an external command to take parameters from the command line, e.g. $ Plott_WERA16_Grid :== $$DATA1:[WERA.Fortran]Plott_WERA16_Grid.exe Call with $ Plott_WERA16_Grid <measurement_file>.spec e.g.: $ Plott_WERA16_Grid $DATA5:[Hawaii]20022921330_kna.spec |