| https:///weradocs/Plott_WERA16_SORT.shtml |
A second optional parameter can be used to pass the name of a configuration file. This file must be located in ~/etc e.g. ~/etc/params_Hawaii.cfg . If no optional parameter is supplied, the configuration is read from ~/etc/params.cfg .
Visualizes backscatter spectra from raw data (.SORT), i.e. vs. range and direction.
Reads all information needed from the header (first 512 bytes of data file).
The following box shows a typical output generated by Plott_WERA16_SORT:
wera@ifmpc205:~/Fortran> ./Plott_WERA16_SORT /home/wera/data/examples/20022921330_kna.sort params_oahu.cfg Plott_WERA16_SORT V1.1.8 Linux: *** Reading configuration from /home/wera/etc/params_oahu.cfg *** Now processing /home/wera/data/examples/20022921330_kna.sort Frequency = 16.0499992 MHz NSER = 2048 Samples T_chirp = 0.260000 s F_bragg = 0.408730 Hz Last RC = 128 range cells RANGEresol = 1.2000 km RAN_OFF = 0.5000 RC TRUE_NORTH = 299 degrees Linear array: Antennas 1 to 16 W16beam: 2048 SAMPLES 19-OCT-02 13:30 UTC Kaena FMSOCO FREQUENZ 16.05 *** FullCalib does not exist ....: /home/wera/etc/Kaena.fullcal *** Reading WERA_Gain ...........: /home/wera/etc/wera_gain.dat *** Calculating S/N of each antenna. *** Normalizing antenna gains. *** Forming beams. Range cell [1..128], Beam +/-60 --> 20 -10 X Display [X], PostScript [P], GIF [G] -> x Enter <CR> to continue. |
Graphics
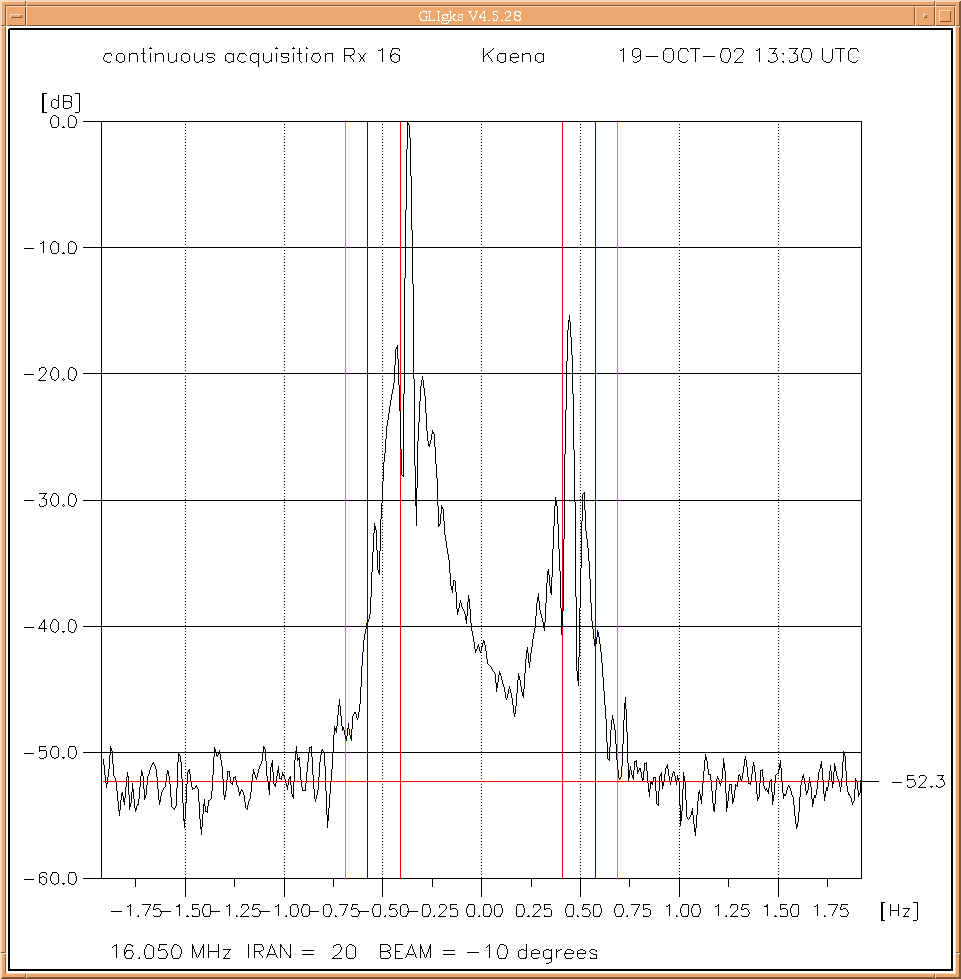
output can be generated for each selected range cell and direction:
When standing in the center of the array, ant.1 to the left, ant. 16 to the
right, looking at the sea, the direction 90 degrees off the array direction
refers to zero degrees; to the left of this line the sign is negative, to the
right the sign is positive.
The example shows a backscatter spectrum about 24 km off the WERA site
at Kaena. Two strong first-order peaks can be seen with a slight shift to
higher frequencies relative to the Bragg lines (in red). The second-order
bands can also be identified left and right of the two first-order peaks.
The location of the harmonic peak (in blue) and the corner reflection peak
(in green) is also shown. The horizontal red line markes the noise level
of the spectrum.
Linux: Source is in Plott_WERA16_SORT.F Compilation and linking with '. do_plott_wera16_sort.sh' Compilation and linking with '. do_X11R6_plott_wera16_sort.sh' Call with > Plott_WERA16_SORT <measurement_file>.sort e.g.: > Plott_WERA16_SORT /home/wera/data/kaena/20022921330_kna.sort |
VMS: Source is in Plott_WERA16_SORT.F Compilation and linking with '@Plott_WERA16_SORT' Program needs to be defined as an external command to take parameters from the command line, e.g. $ Plott_WERA16_SORT :== $$DATA1:[WERA.Fortran]Plott_WERA16_SORT.exe Call with $ Plott_WERA16_SORT <measurement_file>.sort e.g.: $ Plott_WERA16_SORT $DATA5:[Hawaii]20022921330_kna.sort |